How is Your Asset Performance?
“How is your asset performance?” is probably a question that you typically get from upper management. It can be very challenging to answer for organizations that are often running in reactive mode.
The story below is a worst-case scenario to provide a brief view of the various moving pieces in an operation.
Hypothetical Story
An Industrial Operation is getting downtime too often, equipment is not able to meet production targets, and it is experiencing slowdowns. It is hard to analyze root causes and/or carry on any investigation due to the lack of visibility of asset health, and the data is not easy to find. Other operations and support teams are also struggling to keep up. Alarms are overwhelming, the control loops are not tuned, and operators are often having to make manual interventions to bring the process under control or to adapt to logistics issues, as raw materials are not in queues to sustain the production.
The process efficiencies and equipment effectiveness (OEE) are very low, a lot of waste is incurred, and many opportunities are lost. The product quality is not consistent; operations over-processes it to meet specifications. In addition, the plans need to consider over-production to be able to meet production demands. The mean time to repairs (MTTR) and mean time between failures (MTBF) remain very high as maintenance teams must troubleshoot the issues during the task, often spending a lot of time back and forth between the shop and warehouse, and that is if they are not waiting for spare parts to come in. Resource allocation is a challenge as it is hard to understand whether the issue requires mechanical, electrical, and/or instrumentation personnel. The cost of maintenance and energy consumption is constantly increasing.
Quantifying Opportunity Losses, Downtime, Delays, and Waste
How do we debottleneck the above operational problems and quantify opportunity losses? One of the tools that have been very effective at bringing teams together is a downtime tracking and reporting solution, often referred to as delay accounting. For the purpose of this document, we will refer to it as Opportunity Losses. In other words, it provides the ability to visualize bottlenecks and constraints.
A key component of this tool is the Time Usage Model (TUM). TUM enables teams to plan and measure the use of the schedule and availability. What makes the time usage model unique is that it provides a common language and, to a certain degree, a contract among operations, maintenance, and other business functions on how they will collaborate and identify and measure sources of delays or losses. This could go even further to identify and measure sources of manufacturing waste – transportation, inventory, motion, waiting, overproduction, over-processing, and defects or out-of-spec products.
The figure below depicts a generic time usage model. As operational events like the ones described in the hypothetical story happen, those events can be mapped and associated against the proper TUM breakdown so the impact of those events can be measured. The breakdowns also define ownership so the issues can be investigated and fixed by the relevant functional team. In addition, the quantification of opportunity losses or waste due to underutilized capacity, among other things, can be automatically calculated to feed reports, send notifications, and trigger workflows for further actions.
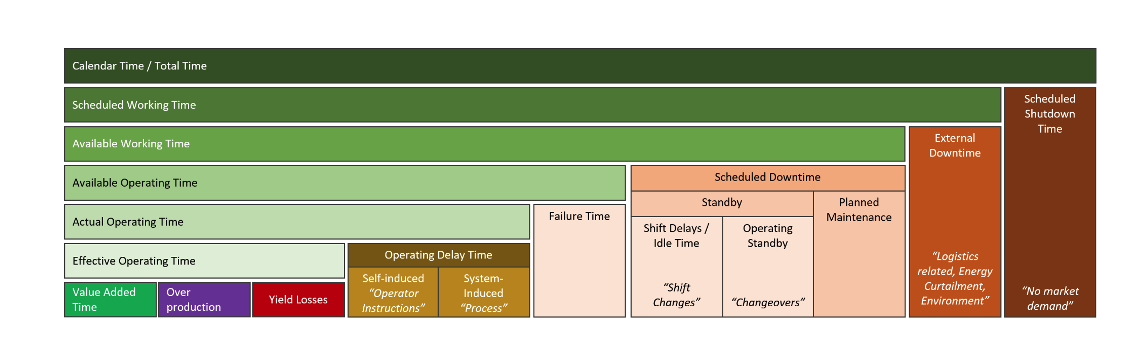
This generic model includes value-added time, overproduction, and yield losses, which are also important to measure. At the end of the production, is the quality team finding too much out-spec production? Are the inventory levels unnecessarily increasing due to overproduction? Is the cost of holding that inventory too high? Is the overproduction considered added-value time?
For the Time Usage Model (TUM) to be truly effective, organizations will need to model the expected state of the manufacturing processes, which will need to include capacities, cycle times, takt times, and available times, among other parameters.
Modeling the Manufacturing Process
A good way to model those processes is by using Value Stream Mapping (VSM) and the Theory of Constraints (TOC).
VSM helps you map current and expected cycle times, processing time, change over time, residence time, queue and waiting times at each part of the process, and to a larger degree, their value chain. This includes looking at the variations required to manufacture the various products in the facility. Through this process, organizations can have a better understanding of the expected, planned downtime and deliver measurable targets on how the organization needs to operate or baseline to compare against to identify efficiency deviations and/or excursions on your processes.
To help you visualize how all of the above relate to one another, the image below depicts a sample of a VSM chart for a Cement process. Using VSM, organizations can understand cycle times at each process which can be used as target production rates. In addition, residence and lead times for each buffer and inventory to sustain production rates. With this, takt time can be determined for each product family. Takt time is a calculation of the available operating time divided by customer demand. This time ensures smooth material flow and avoids any occurring delay or bottleneck in the production line.

Masmali, Majed. (2021). Implementation of Lean Manufacturing in a Cement Industry. Engineering, Technology & Applied Science Research. 11. 7069-7074. 10.48084/etasr.4087.
TOC can be used in parallel. This helps organizations identify and understand current constraints, find ways to exploit the constraints, and subordinate and synchronize to the constraint so the performance of that constraint can be elevated accordingly for continuous improvements. An opportunity losses tool operationalizes the TOC process as it can be configured to help identify and understand bottlenecks and constraints quickly.
To define a good configuration for this tool, a process flow diagram is typically used. Through workshops, the focus is on mapping critical streams and equipment, understanding the redundancies that will ensure production rates and areas where an equipment failure will reduce production rates and can starve buffers and inventories for downstream processes. All of this is important in order to understand what needs to be measured and monitored to ensure capacities are optimally utilized to sustain target production rates and cycle times at each process to complete customer orders per takt times.

Source: Clement Institute
The Choke Model is another method that leads to a similar outcome. My ex-colleague, Bill Tubbs, explains this very well in his blog The Choke Model.
Maximizing The Effect of a Predictive Maintenance (PdM) Strategy
As Industrial operations are able to measure current asset performance most consistently, they are able to continuously understand areas of improvement - missed opportunities, delays, downtime, waste, underutilized capacities, and resources. These improvements may include the implementation of energy meters, online quality analyzers, condition-based monitoring systems, and predictive maintenance strategies.
The use of opportunity loss tools and a TUM will allow industrial operations to identify what equipment will benefit from more sophisticated predictive maintenance strategies. This may include subscribing to Insights as a Service offering from OEMs and/or third-party service providers that help them identify anomalies and predict failure on those assets. An OEM and/or service provider will specialize in a set of equipment or systems - compressors, motors, heat exchangers, HVACs, pumps, and turbine generators, among others. By subscribing to one of those insights as a service, industrial operations must bring those insights into the context of their operations. A failure on equipment that has redundancies in place may not impact production and/or operations. A PdM strategy for every piece of equipment may not be required, and a run to failure can be just fine. This is especially true for equipment where failures do not have a great impact on business objectives and goals.
Industrial operations can leverage an opportunity losses tool to help establish a data-driven and collaborative approach to establish a better process for continuous improvements.
Analytics Opportunities for Improving Asset Performance
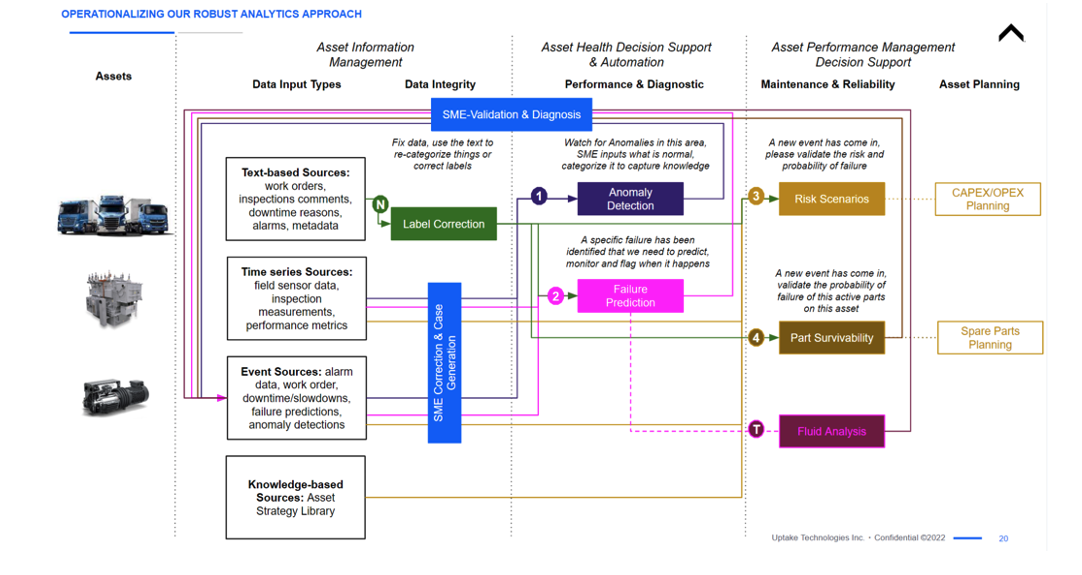
Beyond the typical predictive maintenance use case, there are other areas where analytics can help industrial operations in the journey of sustaining asset performance. The image below provides a simplistic view of those opportunities, which may include:
Label Correction - garbage in, garbage out, and data quality continue to be a key challenges for many organizations.
Anomaly Detection - not enough insights to understand what anomalies are happening more often. Using a generic method to identify anomalies could help prioritize the type of failures that may root cause analysis and need to be predicted.
Failure Prediction - with very specific failures, models can be developed to detect those failures early enough from real-time data to help plan appropriate actions.
Risk Scenarios - as much insight may be generated from data and models, understanding the priority based on risk to value drivers and levers will help drive better utilization of CAPEX and OPEX investments.
Part Survivability - understand what parts may be required to be ordered and what quantities to keep inventories to the right level to support maintenance teams.
Fluid Analysis - fluids are leading indicators of asset degradation and can offer early insights into changing conditions.
Industrial Data Analytics Hub As An Enabler
Using a similar approach mentioned above, Davey Textiles has established a great vision, strategy, and roadmap for all their equipment and taking their organization through cultural adaptation. The cultural adaptation started with a downtime tracking solution (shown below) that allowed them to move from a pen-and-paper process to an automated process of capturing and reporting to senior management.


Using this approach, Davey has been able to invest wisely in equipment and increase capacity by 150%, which has generated more jobs for the community. Next in their journey, they are now ready to start investing in more advanced analytics across their critical assets.
Similar applications can be implemented for other industries, which can include more specific analyses for key asset types, as portrayed by the screens below.

Uptake Fusion is an enabler for the implementation of opportunity losses and analytical tools mentioned above. For more information, please contact us.